Oklahoma Bar Journal
Determining Radio Frequency Coverage in Criminal Cases
By Richard Miletic
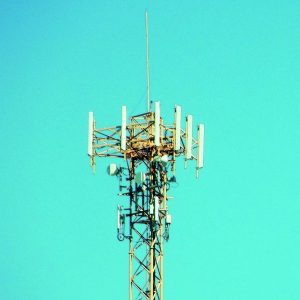
Figure 1: Cell site with 3 sectors
In criminal cases, certain techniques are used to determine the location of a mobile phone at the time of a crime. This article explains new methods of figuring out radio frequency (RF) coverage with a high degree of accuracy in order to establish the location of the phone in relation to the serving cell site at the time of the incident.
In order to determine the location of the mobile phone, a subpoena is served upon the cellular network service operator. The service operator provides Call Detail Records (CDRs), Cell Site Location Information (CSLI) for a certain time period for a specific mobile phone number and a list of the cell sites in the general area. Serving cell sites are the sites that the cellphone was connected to during the calls. Among other things, the CDR includes cell site ID information that indicates which cell was handling the call. This is how the location of the phone is matched to the location of the cell site. The problem with this is that the phone can be anywhere within the coverage area of the cell and the exact location is unknown. It is important to determine the coverage areas of the serving cells so that one knows the general location of the mobile. CSLI data may or may not be available as it is only kept by the network operator for no more than a few months. This data uses proprietary techniques to calculate a location for the phone and a confidence level of its accuracy. The problem with this is that there is no way of verifying the methods used to determine the location, and the network operators do not provide any detail on how they determined it.
Due to the highly technical nature of the information and its importance in many cases, it is highly beneficial to hire an expert witness who has experience in cellular network design, optimization and mobile phone location.
BACKGROUND
In a typical cellphone network, a cell site is comprised of three sectors with one transmit and two receive antennas per sector. (See Figure 1.)
They are easily distinguishable because of the triangular shape. Some towers will have multiple network operators using the same tower and/or have multiple technologies on the same tower. The antennas are designed to transmit over a 120-degree beam width such that by combining all three sectors the result is full coverage around the cell. This is done to increase coverage and capacity as opposed to having a single antenna transmitting a circular pattern.
With that said, some cells are omnidirectional (circular) and some have three, four and six sectors, but the three-sector cell is by far the most dominant in the industry. Each sector on a four-sector cell covers 90 degrees. Each sector on a six-sector cell covers 60 degrees. Whatever the case, the cell site information is provided and thus the RF coverage analysis can be done accordingly. Figure 2 is a simple representation of the difference between an omnidirectional, three-sector and six-sector cell.
Cellular networks consist of several cell sites that connect to each other and to processing servers and telephone switches via high-speed copper, fiber optic or microwave links. In a large metropolitan area such as Chicago, there may be over 1,000 outdoor or macro cell sites serving the mobile phone users. These outdoor or macro cell sites consist of a small building containing the processing equipment and cabling and antennas that are mounted on a building or tower.
For large indoor venues such as sports stadiums, hospitals and airports, Distributed Antenna Systems (DAS) are installed. These consist of several antennas mounted inside the venue connected with coax and fiber to a central point. The wireless operators connect the cellular network to the DAS at this point. The purpose of these antenna systems is to increase the capacity (number of served users) and the coverage in order to support high density of users and provide better coverage indoors.
When a cellphone initiates a call, the cell site sector with the best coverage and quality of service is assigned based on real time signal strength and quality measurements by the phone and the cell site. A series of communication messages between the phone and the network occur in order to assign a frequency and channel number for communication. After the call is established, the phone continuously measures the signal strength from the serving and surrounding cells in case it needs to hand off to another cell site. Details of the call are kept in the network processing equipment for billing, engineering and call processing.
CASE ANALYSIS
Recent cases have shown that the government uses vague descriptions of cell site coverage areas. These usually consist of an arbitrary radius from the cell site in a circular pattern or in a directional or sectorized arc pattern.
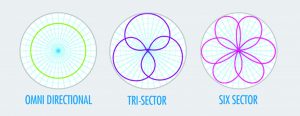
Figure 2: Cell site sectors
As in the following cases, the radius is typically arbitrary and not scientifically determined. The prosecution will typically create a coverage area that is its “best case” and encompasses the crime scene, thus “proving” that the defendant was in the area of the crime scene.
When the prosecution provides this type of map as evidence, it is important for the defense to obtain the CDR and CSLI information directly from the wireless operator and hire its own expert to create coverage plots that are based on a more scientific approach.
United States v. Carpenter1
In Carpenter, the U.S. Supreme Court held that police must usually get a warrant to access historical CSLI. While all the press in this case is about Fourth Amendment rights, a cellular network design expert will investigate the actual testimony regarding the determination of the cell site coverage area.
At trial in Timothy Carpenter’s case, FBI agent Christopher Hess said that in an area like Detroit the cell sector’s signal could reach “typically anywhere from a half-mile to two miles.”2 The government assumed a three-sector cell each with a 120-degree angle for each sector with a radius of two miles. The image would look something like Figure 3, with the arrow pointing to the proposed coverage area.
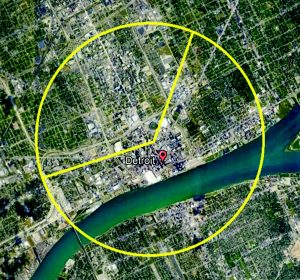
Figure 3: Cell site with 120-degree sector and 2-mile radius
This is not the exact location of the cell site in the case, but a sector with a 2-mile radius is quite large, and in reality, there could be a dozen or more cells within this arc. Also, the actual coverage would look nothing like the arc shown in this figure.
Thus, again it is clear that the government overestimates and simplifies the coverage area. By using a more scientific approach, the defense team can mitigate or even eliminate the prosecution’s argument about the phone being within the coverage area at the time of the crime.
United States v. Davis3
The defendant in United States v. Davis was charged with committing several armed robberies. MetroPCS supplied 67 days of cell site records for the phone in question as well as the relevant cell site locations.
The prosecution’s expert witness stated that “a cell tower would generally have a coverage radius of about one to one-and-a-half miles.”4 He also said that urban areas could have smaller coverage areas, but he did not say how much smaller. Further, it was stated that cellular companies are installing small cells that may cover an area of 10 meters.
Hundreds of small cells could fit in a circle with a radius of 1.5 miles. It is very clear that identifying the cellular coverage of a cell cannot be done arbitrarily. A much more scientific approach is needed.
People v. Brim5
In Ronald Brim’s case the prosecution’s expert used a 1-mile radius for each cell site. This was the “outside reach” or best case for the prosecution. Los Angeles is very dense and nearly all its cell sites are sectorized. Thus, this representation of the cell site coverage was highly slanted toward the prosecution.
In all these cases and many more, prosecutors used arbitrary methods of calculating the coverage of a cell site and used the “best case” scenario for them to place the phone at the crime scene. Daubert requires that “scientific methodology” be used. This is an opportunity for defense attorneys to contest the prosecution’s methods and to use an expert witness that will bring more proven methods of determining cell site coverage.
United States vs. Evans6
In this case, the court struck down what the prosecution’s expert called the “granulization theory” of determining cell site coverage. This theory assumes the phone is served by the nearest tower and coverage estimates of the tower are based on “training and experience.”
First, a cellphone is not always served by the nearest tower and second, it is impossible to determine the actual coverage unless you have additional data about the cell site and/or drive test data which in this case there was neither. Coverage must be determined by “scientific calculations” according to the court thus the granulization theory was denied and the prosecution could not show their estimated coverage of the towers.
U.S. v. Mamah7
CSLI data is being used more often in cases by the prosecution. This data is called different things depending on which network operator is supplying it. Verizon calls it RTT and AT&T calls it NELOS. Basically, they are providing latitude/longitude locations of the mobile phone along with a degree of confidence about its accuracy.
As explained previously in this article, CSLI data may or may not be available as it is only kept by the network operator for no more than a few months at most. This data uses proprietary techniques to calculate a location for the phone and a confidence level of its accuracy. The problem with this is that there is no way of verifying the methods used to determine the location and the network operators do not provide any detail on how they determined it. Displaying the locations as individual points is not accurate. At best it should be displayed as a geographic area including estimates of the relative error of the estimate. Worst case is that the data shouldn’t be used at all as there is no technical explanation of how the location estimate is calculated.
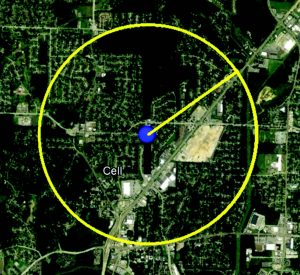
Figure 4: Omnidirectional cell with arbitrary one-mile radius
In U.S. v. Mamah, the court states “It is critical under Rule 702 that there be a link between the facts or data the expert has worked with and the conclusion the expert’s testimony is intended to support. See Gen. Elec., 522 U.S. at 146, 118 S.Ct. 512 (‘A court may conclude that there is simply too great an analytical gap between the data and the opinion proffered.’). The court is not obligated to admit testimony just because it is given by an expert.”
Since the underlying data provided by the network operator cannot be verified then it cannot be used as there is no link between the technology used to create the estimate and the estimate itself. In addition, the location estimate should not be displayed as a point on a map as the data provided by the network operator is an “estimate” of the location and a confidence level and/or error value.
EXPERT WITNESS
The defense team brings in an expert witness to analyze the mobile and network data, decide as to the location of the phone at the time of the incident and dispute the prosecution’s claims concerning the location of the mobile phone. This must be based on scientific evidence that satisfies the Daubert8 or Frye9 rules depending on the jurisdiction in which the case arises. To meet the Frye standard, scientific evidence presented to the court must be interpreted by the court as “generally accepted” by a meaningful segment of the associated scientific community. The Daubert standard supersedes Frye and provides a set of guidelines to assure that data is relevant and comes from “scientific knowledge.” The data must be presented by an expert witness complying with Rule 702, which is as follows:
A witness who is qualified as an expert by knowledge, skill, experience, training, or education may testify in the form of an opinion or otherwise if:
- the expert’s scientific, technical, or other specialized knowledge will help the trier of fact to understand the evidence or to determine a fact in issue;
- the testimony is based on sufficient facts or data;
- the testimony is the product of reliable principles and methods; and the expert has reliably applied the principles and methods to the facts of the case.
The prosecution wants to prove the phone could have been at the incident, and the defense wants to prove that the phone could not have been there or was somewhere else. This all comes down to determining the actual coverage of the cell site at the time of the crime. Determining whether the phone and incident were within or not within the coverage area at the same time may be key to determining the outcome of the case. It is critical to get this right because an innocent person may go to prison.
DETERMINING ACTUAL COVERAGE
In order to determine the actual coverage of a cell, a combination of sophisticated RF modeling and drive testing must be performed. RF modeling is done with software that imports antenna patterns, network characteristics, terrain, morphology, traffic data and building databases. Through proven algorithms, it creates a coverage plot or heat map. The accuracy of the coverage plot can be further improved by drive testing samples of the area and fine tuning the modeling parameters with actual measured data. Cellular network providers have used this method for many years to design and optimize cellular phone networks.
The cell site antenna transmit pattern is key to understanding its coverage. Many different types of antennas are available, depending on the need for the network design. The antenna manufacturers test their antenna models in an enclosed RF chamber in order to determine the profile pattern. The RF chamber blocks out any external radio signals so it does not disrupt the test. The output of this test is a profile that may look something like the photo in Figure 5. The image in Figure 5 is a 3D representation because in reality antennas transmit in 3D space. The blue color indicates a stronger signal because this is closest to the RF source.
The antenna patterns in Figure 5 look similar to a circle or an arc, but not exactly. Antennas also have side or back lobes, as can be seen in the left side of the figure to the left of the main lobe. These are functions of the antenna design.
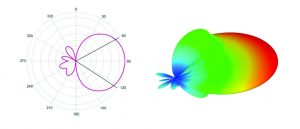
Figure 5: 2D Antenna Test Pattern (Left), 3D Antenna Pattern (right)
Many variables can affect the actual coverage of an antenna in the real world, including the following:
- Antenna height
- Transmit power (output power at the antenna)
- Antenna down tilt (angle of antenna pointing down from horizontal)
- Terrain (hills, mountains, valleys, etc.)
- Clutter (trees, grasses,
foliage, buildings, etc.) - Traffic patterns (busy times usually decrease the coverage)
- Interference (signals from other cell sites, external transmissions or generated from poor cell site cable connections)
Another major factor affecting coverage area is the terrain and clutter. The world is not a flat surface. Mountains, hills and crevices will block radio signals. In addition to terrain, there is morphology or clutter. This consists of everything on top of the terrain including trees, grasses, water and rocks. These either block or soak up radio frequency, essentially decreasing the coverage area. Buildings have a significant impact on RF coverage. Steel, concrete and tempered glass are all materials that will block or reflect RF.
Finally, the amount of traffic on the cellular network has a significant impact on the coverage of the cell. This is dependent on the technology, but in general the more traffic on a cell, the smaller the cell’s coverage area. There is a maximum number of
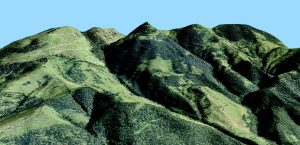
Figure 6: Terrain and Clutter
calls the cell site can handle. As the number of users increase, the noise they create also increases. Therefore, in order to maintain good call quality, the network prioritizes the callers. The ones that have a poor audio channel may be delayed or blocked from calling. These are phones that are in a high interference or poor coverage area, which is typically at the boundary of the coverage area. If the network blocks these users from the cell, the coverage area essentially decreases. It is therefore important to look at the time of day and peak and nonpeak times when determining coverage.
Figure 7 shows a coverage plot of an area with several cell sites. The sites are shown in black along with their corresponding code names. The icons for the cell sites represent three-sector cells. The heatmap colors are the coverage or serving areas for each cell sector. The boundary area between colors is where the handoffs occur from one cell sector to the next. If a mobile phone was being served by the sector indicated by the black arrow, then it would be deemed to be located within the red area indicated by the red arrow. As Figure 7 demonstrates, the coverage areas of the cells look nothing like circles or arcs. Most coverage areas are shown generally downstream from the antenna, but the shape and size are dependent on all the factors
mentioned previously. This modeling is based on scientific calculations and real-world data.
MEASURED DATA
Drive testing can be performed to further improve the RF coverage model. Drive testing uses a device such as the one in Figure 8. The drive test equipment consists of a high-speed cellular scanner, GPS receiver, cellphones and a tablet or laptop computer. The equipment is installed in a vehicle and then driven around the area of interest to gather actual signal strength measurements being received from the cell sites.
The scanner collects signal strength and cell site parameters for multiple technologies simultaneously. The GPS receiver tags a location to the signal data once per second and stores it on the hard drive of the tablet or laptop computer.
A phone can be connected to the equipment in order to simulate a user experience and try to duplicate the mobile phone in question. Network data collected from the phone indicates the serving cell, signal levels and a host of other data. While it is desired to use the same model of phone as the defendant used, it is not necessary because most phones use similar technology. In addition, radio frequency specifications for the mobile phone are set by FCC requirements.10
The resulting signal strength measurements and their GPS locations are imported into the modeling software. The modeling software uses the actual measured data to fine tune the model and make it more accurate.
Network-related parameters are also collected via a proprietary interface to the USB port on the cellphone. This provides information equivalent to the mobile phone of interest and provides the best duplication of the RF experience.
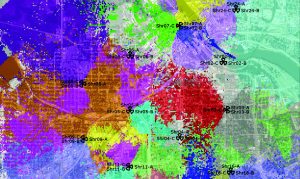
Figure 7: Best Server Coverage Plot
INFORMATION REQUESTED FROM WIRELESS OPERATORS
When requesting information from the mobile wireless operator with a subpoena, it is important to be proactive and timely. Records may be stored for a few months up to several years, depending on the wireless operator. The subpoena should contain the following in order to determine the phone’s location:
All subscriber information, call detail(s), caller identification(s), cell site location information, call detail records.
List of cell sites within a _ radius of _ containing the following for each cell sector (required for RF modeling of actual coverage):
- Latitude
- Longitude
- Ground Elevation (feet)
- Antenna Centerline (feet)
- Antenna Azimuth (degrees from True North)
- Antenna Model
- Antenna Mechanical Down tilt
- Antenna Electrical Down tilt
- Cable Losses (dBm)
- EiRP (Watts)
- Technology (LTE, UMTS, CDMA, EVDO, GSM, etc.)
- MIMO configuration (2 x 2, none, etc.)
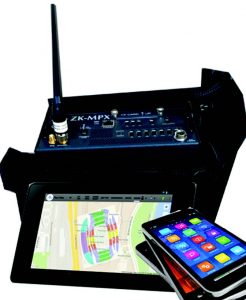
Figure 8: Drive Test Equipment
- Frequency Band
- Channel Number (Channel number for CDMA, UAR- FCN for UMTS, EARFCN for LTE)
- Cell site identification code per technology (PN for CDMA, PSC for UMTS,
PCI for LTE)
All published and nonpublished detailed subscriber records for incoming calls received or outgoing numbers dialed.
Historical Global Positioning Location (GPS) information or location information obtained otherwise without geographical limits.
For the dates _ of through _.
This list only pertains to data requested for determining location. Other phone data may be of interest including, but not limited to, emails, web browsing and text messages.
CONCLUSION
The current method of determining coverage area for cell sites by drawing an arbitrary circle or arc around the cell site is not a scientific method and should not pass the Daubert or Frye test. A better method presented here has been used by cellular RF engineers for many years and uses a combination of modeling and measurements to determine actual coverage. Many criminal and civil cases depend on accurate and scientific information about cellphone location. People’s lives depend on the outcome. The most accurate method available should be utilized to make sure justice is properly served.
ABOUT THE AUTHOR
Richard Miletic is founder and principal of ZK Services in Mountain View, California. He has been in the wireless field for over 30 years. He helps with network design, testing and troubleshooting for cellular, Wi-Fi and public safety systems. He provides expert testimony in criminal and civil cases all over the United States.
©2018, National Association of Criminal Defense Lawyers. Reprinted with permission.
1. Carpenter v. United States, 138 S. Ct. 2206 (2018).
2. United States v. Carpenter, 819 F.3d 880, 885 (6th Cir. 2016).
3. United States v. Davis, 785 F.3d 498 (11th Cir. 2015).
4. Id. at 503.
5. People v. Superior Court of Los Angeles County; Ronald Brim, Real Party in Interest, B229701, caselaw.findlaw.com/ca-court-of-appeal/1560782.html.
6. Case Number 10 CR 747-3.
7. 332 F.3d 475 (7th Cir. 2003).
8. Daubert v. Merrell Dow Pharmaceuticals, 113 S. Ct. 2786 (1993).
9. Frye v. United States, 293 F. 1013 (D.C. Cir. 1923).
10. FCC Electronic Code of Federal Regulations, www.ecfr.gov/cgi-bin/text-idx?SID=be7dbb5d84aa010f5ed384dea0fcf1cd&mc=true&node=sp47.1.2.j&rgn=div6.
Originally published in the Oklahoma Bar Journal -- OBJ 91 pg. 42 (January 2020)